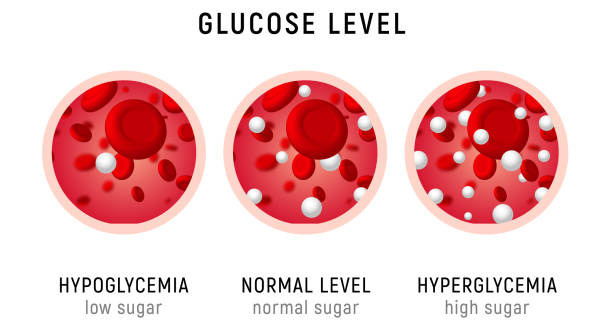
Infographic comparing three blood conditions: hypoglycaemia (low sugar), normal glucose levels, and hyperglycaemia (high sugar). This image helps explain the differences in glucose concentrations and is ideal for educational content about diabetes and blood sugar management.